Most companies do not have a feedback collection problem. They have tickets, reviews, call transcripts, NPS comments and churn surveys, more every week. What they have instead is an analysis problem, and the usual answer to it is a monthly scorecard: an analyst samples the pile, tags it against a list of themes, scores sentiment, counts, and presents the top ten in a deck. It is honest work and it beats nothing.
It is also the wrong shape for the job. A scorecard describes last month. It cannot tell a product manager on Tuesday which theme just moved, which accounts it touched, or what to do about it before Thursday. This guide is about what voice of customer analytics has to measure, how to build categories that survive contact with a changing product, how to keep noise out, and how to connect a theme to a decision. The tools have changed, and the method should change with them.
What VoC analytics has to measure
Three things, and most programmes only get the first.
How often. Mention counts, by theme and sub-theme, with the trend. This is the easy one, and on its own it is misleading: it ranks by who talks most.
How strongly. Sentiment, but at the level of the part of the product being talked about, not the whole review. A customer can praise your reporting and be furious about your exports in the same sentence. One score for the record hides both.
What it is worth. This is where scorecards go soft. Most programmes reach for a correlation: themes that co-occur with churn, argued in a quarterly review. The useful measure is more direct. Join each piece of feedback to the account that gave it, and every theme carries the ARR behind it and how close those accounts are to renewal. That is a number, not an argument, and it is what turns a theme list into a priority list. The roadmap prioritisation page shows how that ranking reads.
Categories that survive the product changing
The classic advice is to build themes inductively from the data rather than from a list you drew up in advance, and to keep them specific enough to act on but broad enough to aggregate. That advice is right. The problem is that a hand-built taxonomy is only correct on the day it is built. Ship a feature and the feedback about it has no home; rename a plan and the old tag keeps collecting.
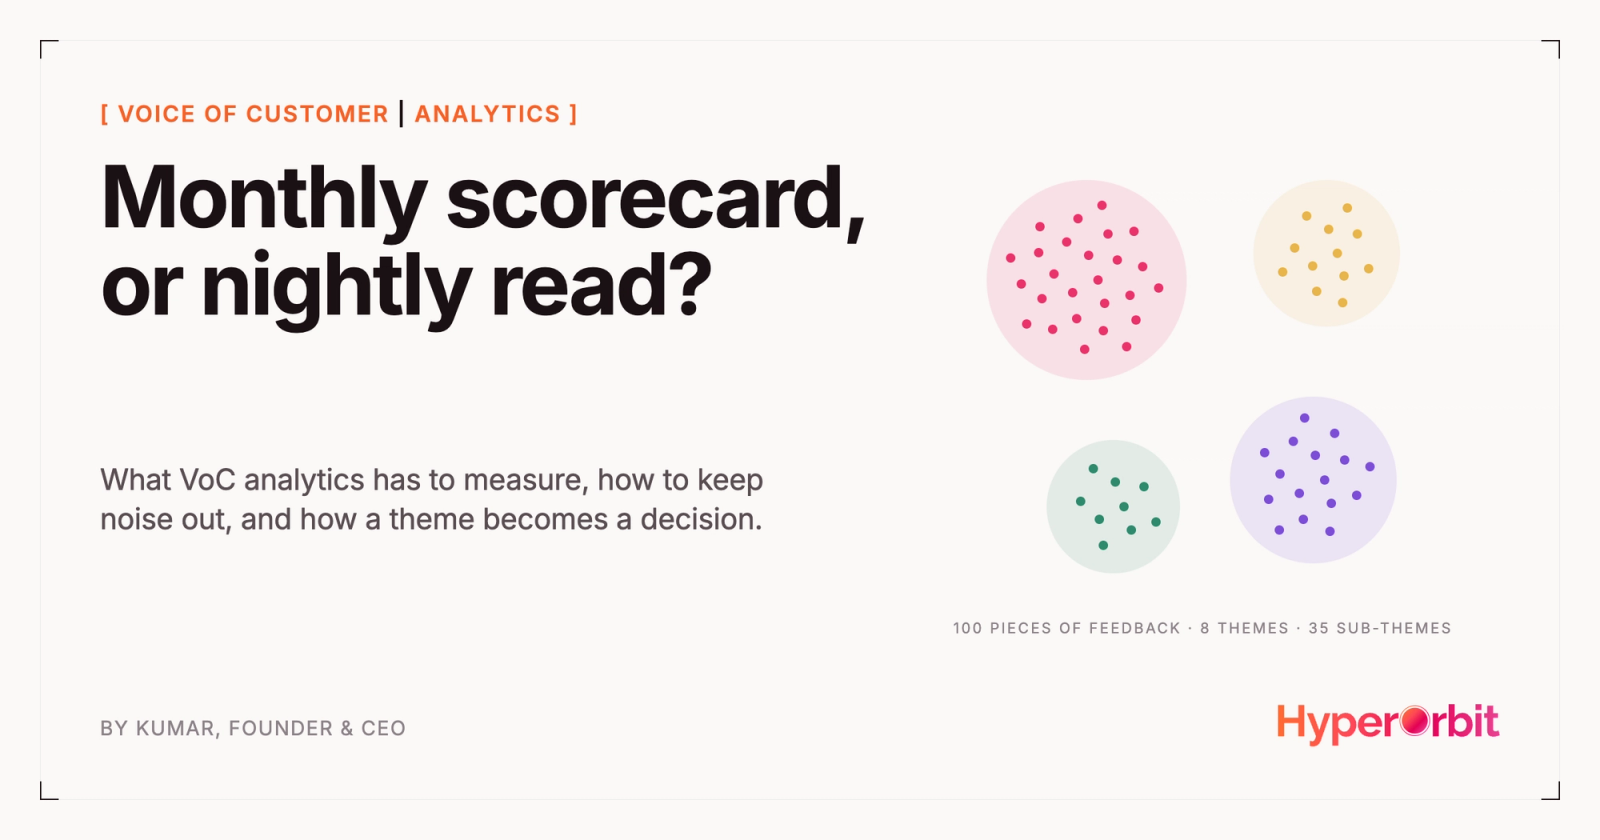
Grouping by intent rather than keyword fixes most of this. In Chorus, a hundred pieces of feedback become eight themes and thirty-five sub-themes, each with a mention count and the quotes behind it, and a new theme surfaces itself when customers start talking about something new. Your team still names, merges and splits; nobody has to notice the drift first. Keep the quarterly review, but make it a review of what the read found, not a chore to keep the tag list alive.
Sentiment you can defend
The warning against trusting an unsupervised AI sentiment score is fair. A model that says "negative" with nothing behind it is not analysis. The answer is not to go back to hand-scoring on a five-point scale, which does not scale past a sample. It is to hold the model to the same standard as an analyst: every line cites the review, ticket or call it came from, every theme carries a confidence, and anything touching pricing or a near renewal is held for a person. Chorus reads every record, every night, and stops at exactly those. Our methodology page sets out what each figure measures.
Keeping the noise out
Four filters that a good analyst applies by hand, and what they become when the read is continuous.
Recency. Weight recent feedback more, and review the taxonomy quarterly, says the manual method. Nightly reads make recency the default: the trend is visible the morning after it turns, not at the end of the quarter.
Representativeness. A vocal minority in the community forum can outnumber your quiet enterprise accounts. Weight by revenue and by segment, and show both counts. A theme raised by three accounts renewing next quarter outranks one raised by fifty on the free tier, whatever the volume says.
Specificity. "The product is confusing" is not a theme. "Exports time out above ten thousand rows" is. The test is whether a fix can be attached; a theme without a fix is a mood, and it should not be on the roadmap.
Contradiction. When half the feedback wants more and half wants less of the same thing, that is not noise, it is two segments. Split the theme by plan or role before deciding anything.
From a theme to a decision
A theme becomes a decision when three things are attached to it: what caused it, what it is worth, and who owns it.
The cause. Feedback rarely moves on its own. A competitor changes its pricing, and pricing complaints follow. Our worked example: a free tier launched on 22 May and, eight days later, pricing complaints were up by 31 mentions across accounts worth $214K of ARR. Cause and Effect puts competitor moves above the line and customer reactions below it, with the lag between them measured, so the theme arrives with its reason.
The worth. The ARR behind the theme and the renewal windows it touches, from the CRM join above. For accounts, Atlas, in beta, fuses feedback, usage, support and CRM into one health score and explains why it moved.
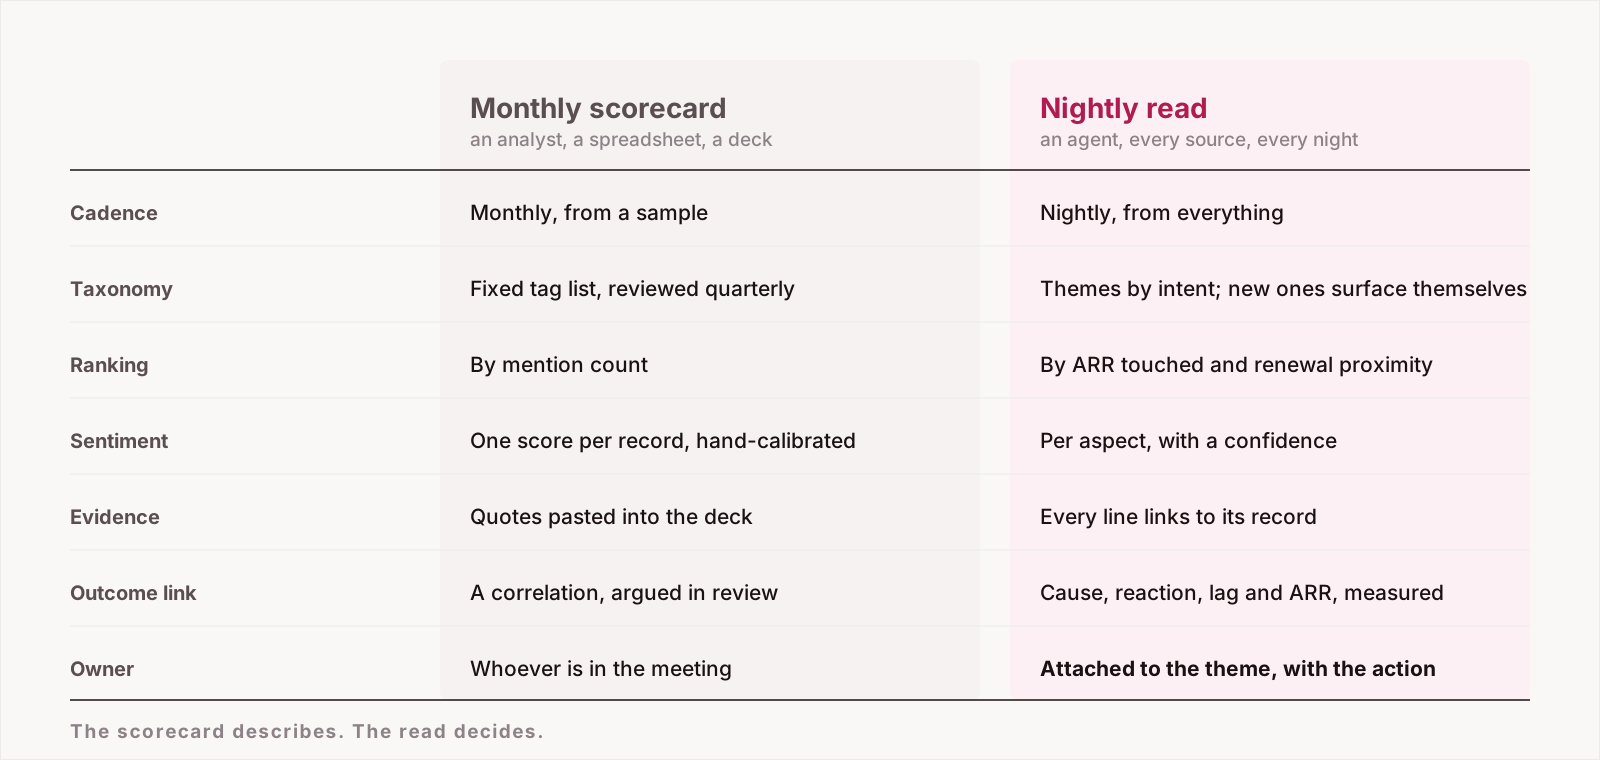
The owner. A theme in a deck belongs to whoever is in the room. A theme in the Signal Desk lands with an owner, a cause and the action, and the loop is closed when the action is taken, not when the deck is presented.
Count the decisions a theme changed and the renewals it kept, not the themes found. A programme that surfaces insights and changes nothing is a reporting function.
Five ways VoC analytics goes wrong
- Reading channels separately. Support sees tickets, marketing sees reviews, sales hears calls, and the same customer is three complaints. One read across every source, with the customer resolved to one account, is the fix.
- Ranking by volume. The loudest theme goes to the top of the roadmap and the most valuable account churns quietly. Rank by what the theme is worth.
- Reading only the negative. Praise tells you what to protect and what to sell. It deserves the same themes and the same sources.
- Treating every customer as one segment. Split by plan, role and region before deciding, or the contradictions cancel out into nothing.
- Never closing the loop. If nobody owns the theme, nobody tells the customer what changed, and the next survey goes unanswered.
Where your programme is
Programmes tend to climb four steps: summarising feedback, then categorising and scoring it, then connecting it to revenue, then acting on it with an owner and a record of what happened. Most teams we meet are on step two and believe the answer to step three is a bigger spreadsheet. The VoC maturity assessment places you in a few minutes, and the customer brain guide is the longer read on what the fourth step looks like inside a company.
If you want to see the nightly read on your own feedback before changing anything, Starter runs Chorus on one feedback source at no cost, with 50 signals and 10 insights a month. Put it beside this month's scorecard and compare what each one told you, and what you did about it.
Frequently asked questions
What is voice of customer analytics?
The method for turning customer feedback from tickets, calls, reviews and surveys into themes with a measured frequency, sentiment and business value, so that product, CX and revenue teams can decide what to fix, build or protect.
What should VoC analytics measure?
How often a theme appears and its trend; how strongly customers feel, scored per part of the product rather than per review; and what the theme is worth, measured as the ARR of the accounts behind it and how close they are to renewal.
How do you separate signal from noise in customer feedback?
Weight recent feedback, weight by revenue and segment so a vocal minority does not outrank quiet high-value accounts, keep only themes specific enough to attach a fix to, and treat contradictory feedback as two segments rather than noise.
How is a nightly agent read different from a monthly scorecard?
The scorecard samples the pile once a month, tags against a fixed list, ranks by mention count and pastes quotes into a deck. The nightly read covers every record, groups by intent, ranks by ARR and renewal proximity, cites the source for every line, measures the cause and lag behind a change, and attaches an owner to each theme.