Every few months a new list of competitive intelligence statistics goes round: the share of large companies with a programme, the share planning to spend more, the multiple by which analytics speeds up a decision. They are useful for one thing, which is persuading a budget holder that competitive intelligence is a category. They are useless for the thing the budget holder will ask next, which is what it should change about your plan.
That is not a complaint about the surveys. It is that a statistic about companies in general cannot say anything about your competitors, your accounts or your quarter. The numbers that change a plan are the ones you measure on your own signal. This post is about which four, and what each one is worth.
Why the industry numbers do not move a plan
Three problems, in order of how often they bite. The samples are of intelligence teams, so they describe companies that already bought; the numbers are about spend and satisfaction, not outcomes; and the figures that do claim outcomes, faster decisions, more revenue, are measured by vendors on their own customers. None of that is dishonest. It is just that "most companies plan to invest" is not evidence that your next dollar belongs in monitoring rather than in reading what your customers already say about competitors.
The one industry finding worth keeping is the one about data: most collected intelligence is never analysed. That is true in our experience too, and it points at the read rather than the collection as the place to spend.
The four numbers that are yours
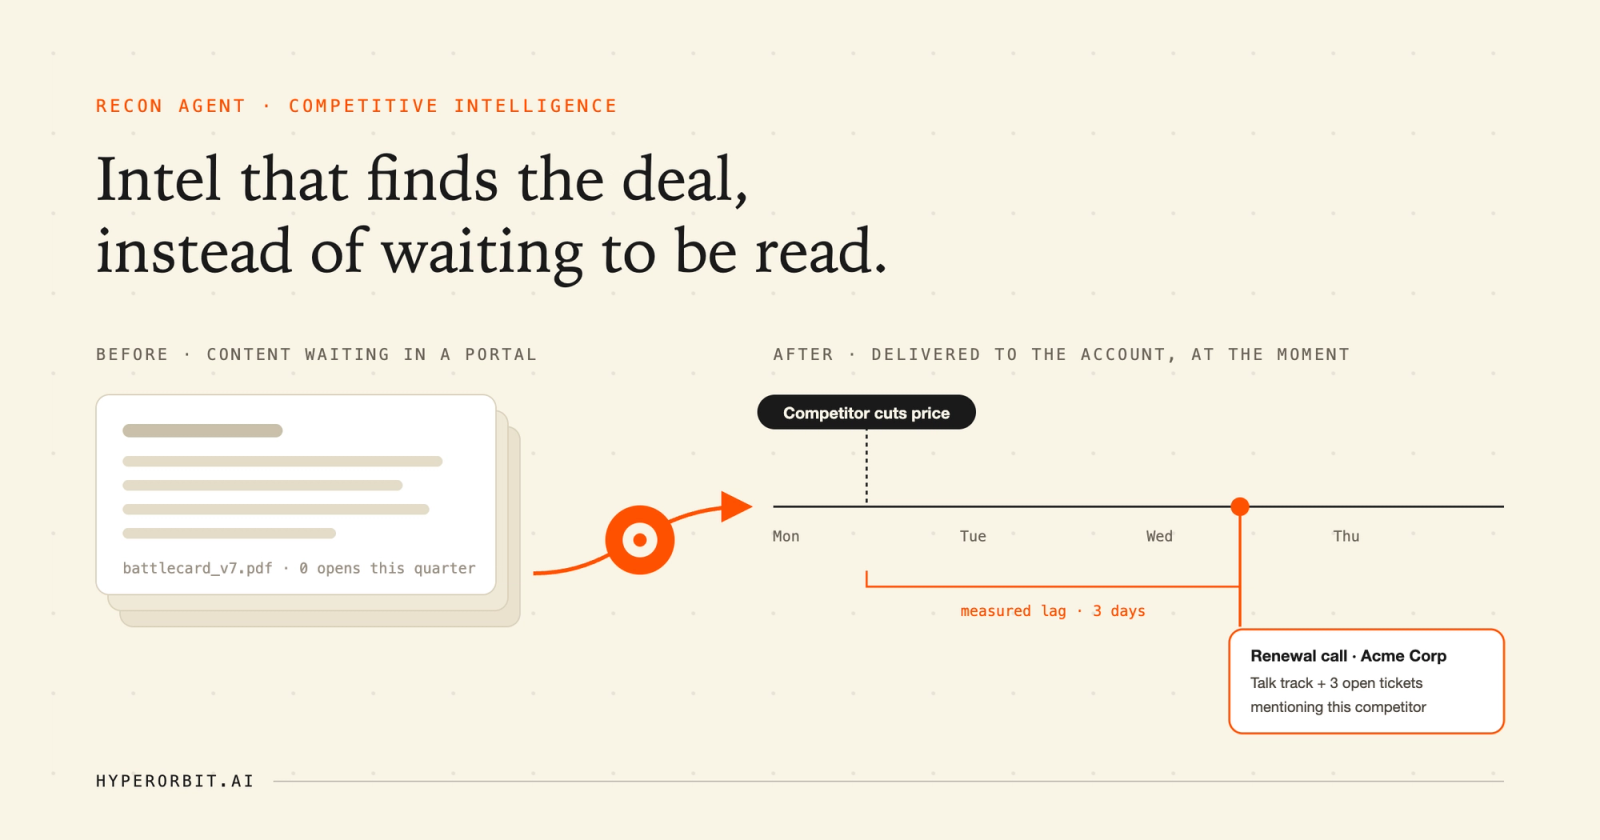
1. Moves detected, and when. How many competitor moves your programme found last quarter, and the gap between the move and the day you knew. For the moves you heard about from a prospect first, the gap is the whole story. Recon sweeps competitor sites, changelogs, pricing pages and reviews daily, so the second number is measured in hours; a monthly review measures it in weeks.
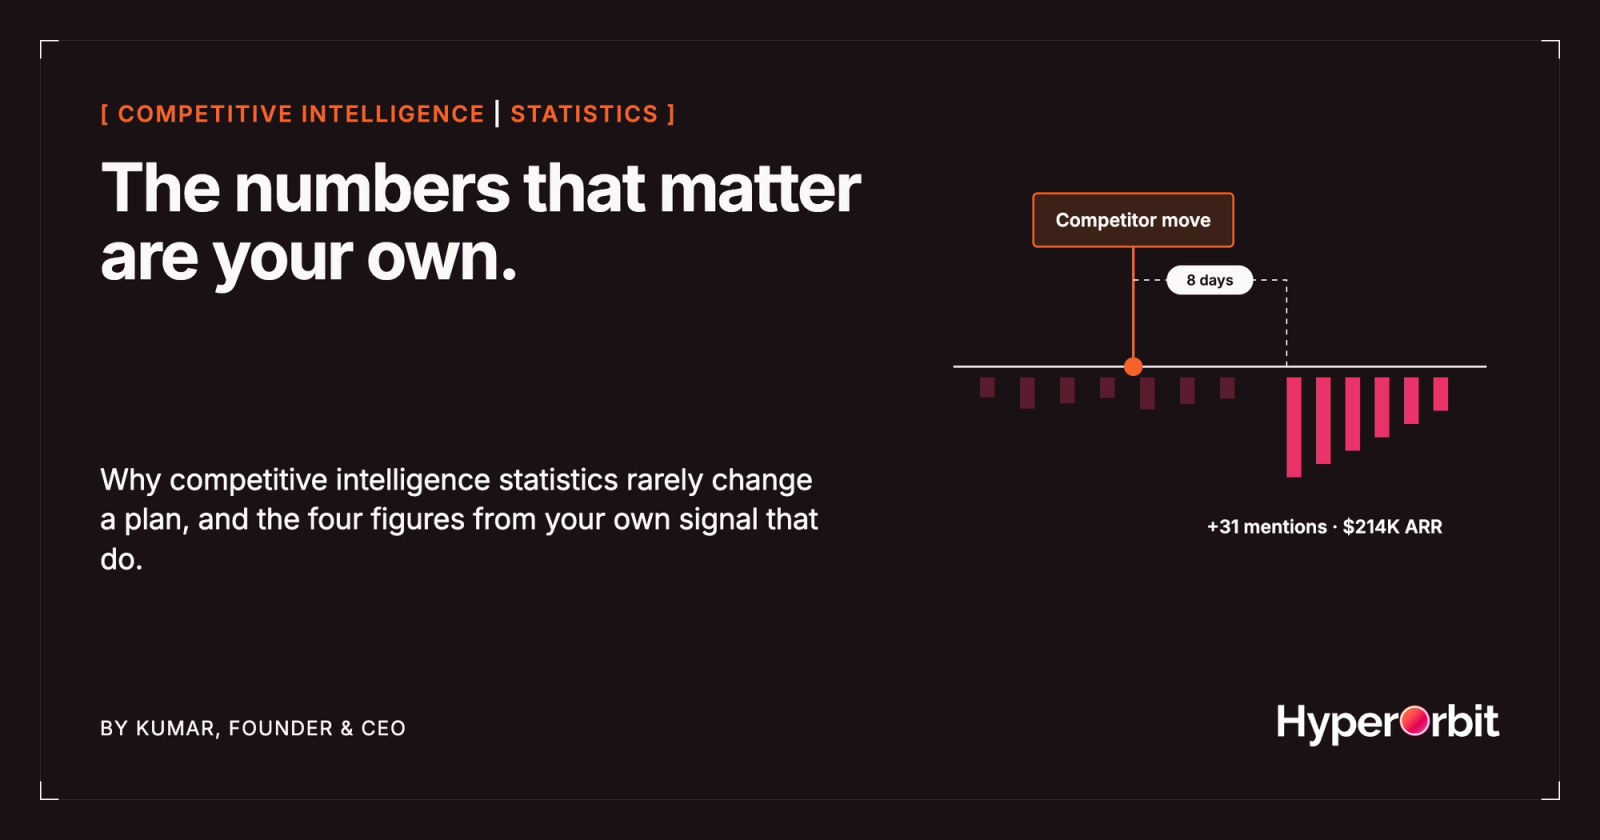
2. The reaction, and its lag. For each move that mattered, what your own customers did about it and how long that took. Our worked example on the methodology page: a competitor launched a free tier on 22 May; eight days later, pricing complaints in the feedback were up by 31 mentions, with the link scored at 68% confidence. That lag is a property of your market and your customers, and once you know it, you know how long you have to respond to the next move of the same kind. No survey of the industry can tell you.
3. Revenue touched. The ARR of the accounts that reacted, and how many of them are inside a renewal window. In the same example, $214K. This is the number that gets a competitor move onto the leadership agenda, and it requires the competitor signal and the customer signal to be joined at the account. Cause and Effect shows the move above the line, the reaction below it, and the lag and ARR between them.
4. Time to counter. From the move being detected to the account owner having the counter, in the tool they work in, before the next conversation. Recon drafts the battlecard with the evidence and a confidence score and holds it for review; the number to track is how long the review takes and whether the brief reached the owner before the call. Adoption, the metric most enablement tools report, is a proxy for this, and a poor one.
A competitive intelligence programme should be able to state, for last quarter: moves detected and the detection lag, the customer reaction and its lag, the ARR touched, and the time to counter. Four numbers, all from your own signal, none from a survey.
What each number changes
- Detection lag decides how often to sweep and which sources to add. If the lag is longest on pricing pages, watch them daily.
- Reaction lag sets the response window. If your customers react in eight days, a counter that takes three weeks is a post-mortem.
- Revenue touched ranks the moves. Two moves a quarter may matter; the other forty are noise, whatever the alert count says.
- Time to counter decides whether the problem is detection, drafting or routing. Most teams find it is routing.
Measuring them without a programme
You can produce all four by hand, once, for one competitor. Pick their biggest move last quarter. Find the date you knew. Search your tickets, calls and reviews for that competitor's name in the weeks after, count the mentions against the weeks before, and add up the ARR of the accounts that mentioned them. Then find the date a rep first had something to say about it. The exercise takes an afternoon, and the four numbers it produces will change your plan more than any statistic on a slide. If you would rather have the read run every night, Starter puts Recon on one competitor source and Chorus on one feedback source at no cost.
We define every figure we publish the same way, on the methodology page: what it measures, from which records, and how it can be checked. Hold your own competitive intelligence numbers to that standard, and hold the industry's to it too.
Frequently asked questions
Are competitive intelligence statistics useful?
For making the case that the category exists, yes. For deciding what to change in your programme, no: they describe companies in general, sample buyers, and measure spend rather than outcomes. The numbers that change a plan are measured on your own signal.
What metrics should a competitive intelligence programme track?
Moves detected and the lag from move to detection; the customer reaction to each move and its lag; the ARR of the accounts that reacted, and how many are near renewal; and the time from detection to the account owner having the counter.
What is reaction lag in competitive intelligence?
The time between a competitor move and a measurable change in your own customer signal, such as a rise in pricing complaints. In HyperOrbit's worked example it is eight days. Knowing it tells you how long you have to respond to the next move of the same kind.
How can we measure these without a tool?
Pick one competitor's biggest move last quarter, find the date you knew, count mentions of that competitor in tickets, calls and reviews before and after, add up the ARR of the accounts mentioning them, and find the date a rep first had a counter. It takes an afternoon.