Most leadership teams know their ARR, new bookings, expansion revenue and churn inside and out.
But there is a number that often gets less attention until it is too late:
How much of our current recurring revenue is actually in jeopardy?
A customer could still be paying. Their renewal could be months away. Their account could look very healthy in the CRM, because nobody has touched the health score.
Meanwhile product usage is down, support issues remain, the original champion has effectively pulled away, and the customer is now looking at other options.
By the time those signals appear in a renewal forecast, the window to intervene may already be shut.
Founders need a weekly view of ARR at risk. Not a generic churn prediction, but a view of the actual ARR sitting in accounts with genuine retention or renewal risk.
What does ARR at risk actually mean?
ARR at risk is the annual recurring revenue associated with customer accounts that have credible indicators of potential churn, contraction or renewal difficulty over a given period.
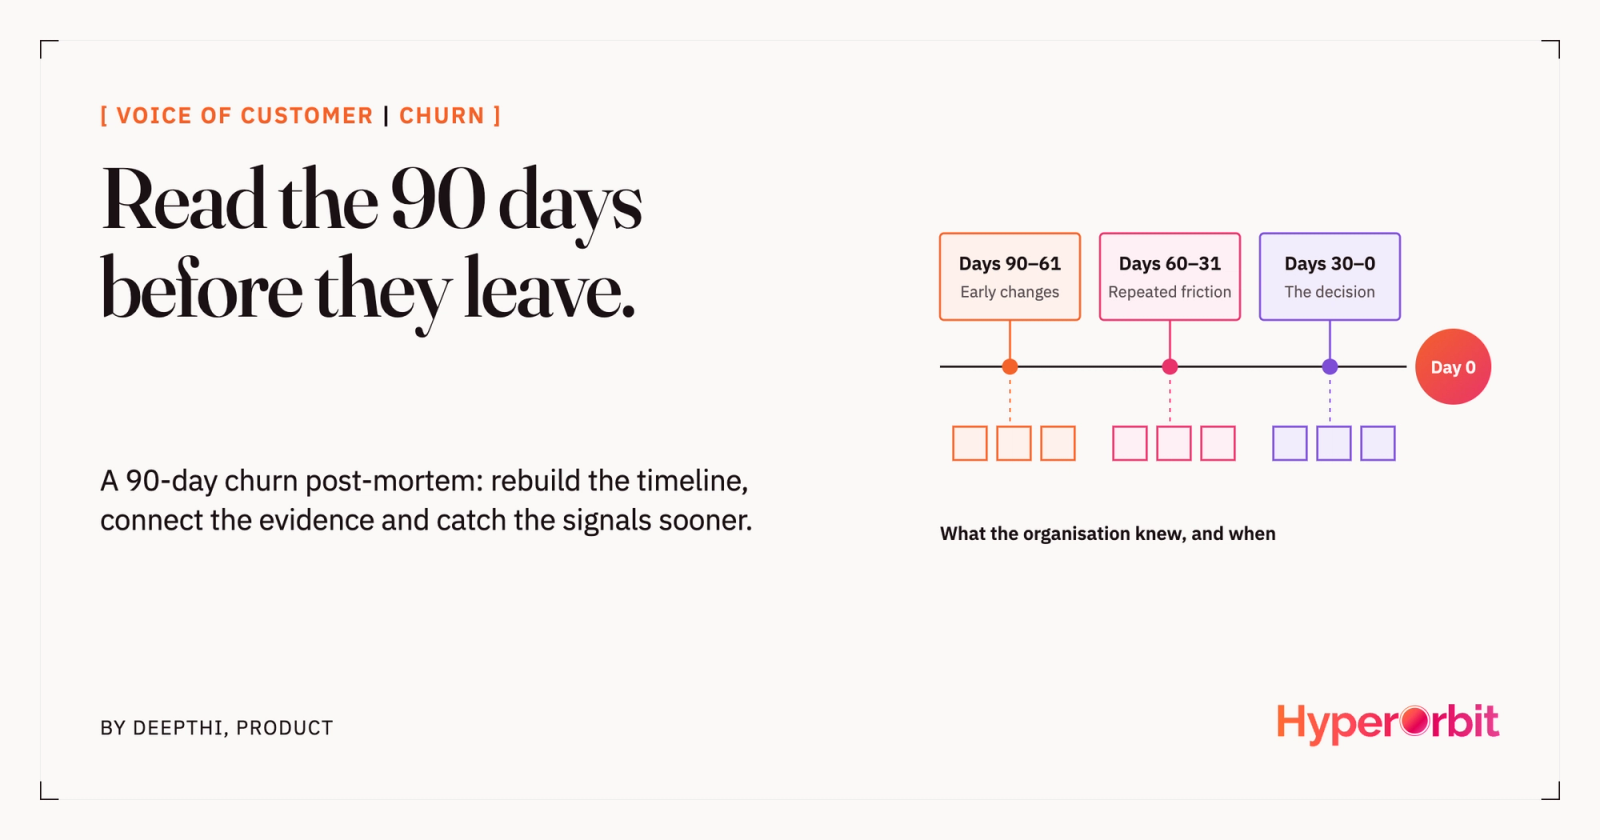
For instance, a company might define its review horizon as the next 90 days.
The basic calculation is:
ARR at risk = the sum of the ARR from accounts that meet the organisation’s defined risk criteria within the review horizon.
Consider a hypothetical SaaS business:
- Account A, $120,000: product usage has declined significantly.
- Account B, $85,000: repeated unresolved support escalation.
- Account C, $60,000: renewal objection and competitor evaluation.
- Account D, $40,000: executive sponsor has left; no replacement identified.
- Total, $305,000: ARR requiring attention.
The company has $305K in ARR from accounts that need review or action.
That does not mean it will lose $305K. It simply means $305K is exposed to identifiable customer risk and needs active management.
That distinction matters.
Customer signals matter more than a single health score
A health score can be useful, but it tends to collapse a whole host of different customer realities into a single figure.
A customer could have a very high NPS and yet be experiencing a fall in product adoption. On the other hand, a customer with a very low NPS may be using the product heavily and firmly in the renewal camp.
Neither sentiment nor product usage alone tells the full story.
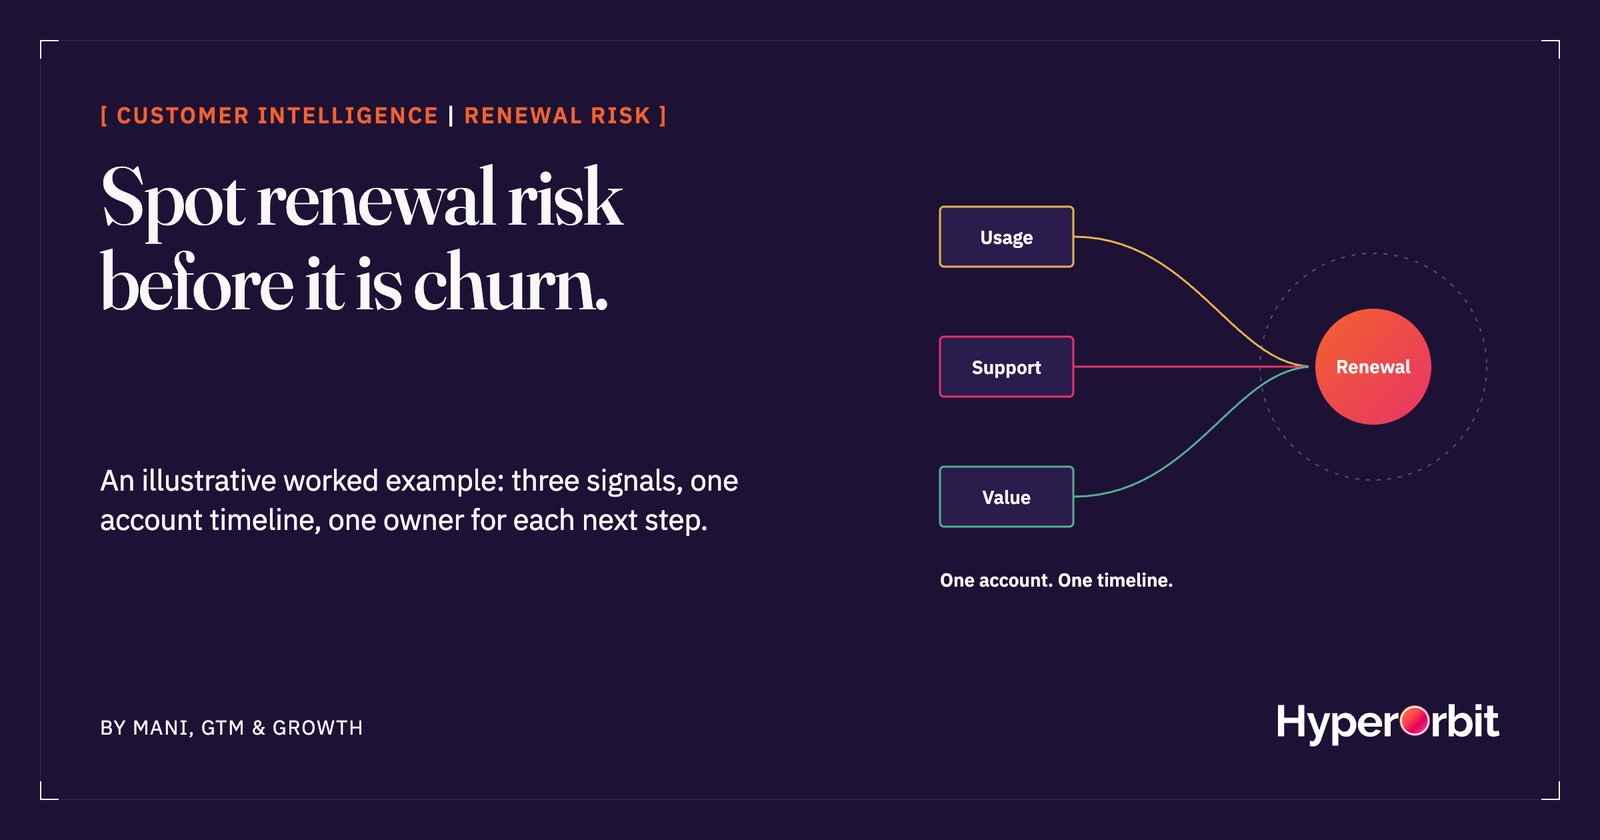
A more useful assessment connects signals across the customer relationship.
Product and usage signals
- Declining active users or declining usage frequency.
- Reduced uptake of key features.
- A drop in engagement across teams or departments.
- An account that was previously active and is now inactive.
Support and experience signals
- Repeated complaints on the same issue.
- Unresolved high-impact support escalations.
- Increasing time to resolution.
- Customer frustration surfacing in a number of interactions.
Commercial and relationship signals
- Renewal objections or budget issues.
- Reduction in contract scope.
- A change in, or departure of, the executive sponsor.
- Lower engagement from decision-makers.
- Explicit competitor comparisons or evaluation activity.
One signal might be of use. Multiple signals, especially if they persist over time, are a better indicator that an account is at risk.
The key issue is not simply whether the customer is unhappy. It is whether credible evidence shows the customer relationship or recurring revenue is at risk.
Give leadership more than one ARR number
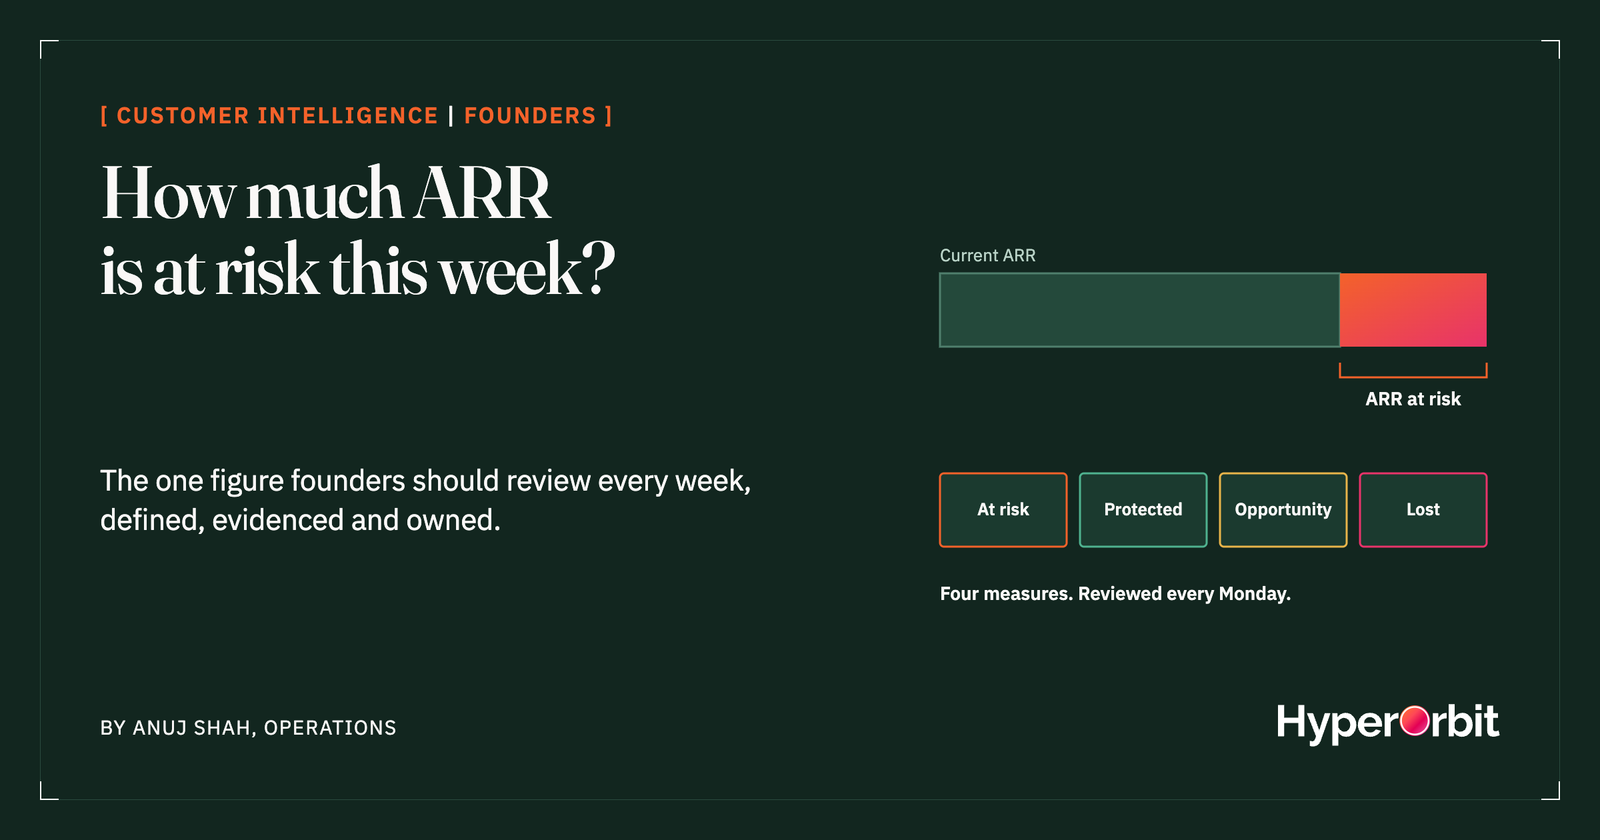
Break a weekly revenue risk review into four distinct measures:
- ARR at risk: revenue associated with accounts showing evidence-backed retention or renewal risk.
- ARR protected: revenue associated with accounts where an intervention has demonstrably mitigated a previously identified risk.
- ARR opportunity: potential expansion revenue from existing customers, tracked separately from retention risk.
- ARR lost: revenue from customers who have actually churned or contracted.
These categories must not be conflated.
For example, an account moving from at risk to protected needs a documented reason for the move: the issue was resolved, adoption recovered, the renewal objection was addressed, or the customer confirmed their continued commitment.
Assigning an owner or scheduling a meeting is not enough. Neither protects revenue.
Similarly, do not report ARR at risk as expected churn. If you want a probability-weighted exposure figure, calculate it separately, and only when the underlying probabilities have been calibrated against historical outcomes.
What should the founder see every Monday?
A useful weekly view should answer five questions.
1. What is the current ARR at risk?
Show the total value and the number of affected accounts, using a consistent definition and review horizon.
2. What has changed since last week?
Show newly identified risks, accounts where risk has increased, accounts where risk has decreased, and accounts with a documented intervention that addressed the issue.
3. Which renewals are coming up?
Break it down by renewals due in the next 30, 60 and 90 days. The timing is critical. A risk on an account renewing next month is very different from one renewing in nine months.
4. What is the root cause of the risk?
Identify the key contributing signals: reduced usage, outstanding support issues, commercial pushback, mentions of a competitor, relationship changes or other account-specific evidence.
5. Who owns the next action?
Every material risk should have an owner, a next step and a review date. A risk metric without a next step is just another dashboard number.
A simple weekly scorecard could look like this:
- Total ARR at risk: $305,000
- Accounts requiring attention: 4
- Newly identified risk: $85,000
- Risk increased: $120,000
- Risk mitigated: $40,000
- Renewals due in 30 days: $100,000
Illustrative only. Those categories and amounts would have to be worked out from the company’s actual account data. Do not add the overlapping categories together as if they were separate revenue streams.
The operating rhythm matters as much as the metric
The number in itself will not protect revenue.
What matters is the operating process. A practical weekly review can follow this sequence:
- Identify: bring together new customer signals from product usage, support, sales conversations, customer success, surveys and wherever else you get them.
- Connect: link those signals to the correct customer account, contract and renewal context.
- Assess: does the evidence point to a real retention risk? Record the source, date, impact and confidence.
- Prioritise: the accounts with the most revenue exposure, the most urgency and the strongest evidence.
- Act: assign an owner, agree an intervention and track what changes.
- Reassess: review the account in the next cycle. Update the status only if new evidence warrants it.
This creates a feedback loop between customer intelligence and revenue management.
It also gives leadership something far more useful than a retrospective churn report: a view of where attention is needed while there is still time to act.
Why this needs to move beyond the CRM
CRMs are vital for account ownership, contract values, renewal dates and commercial activity.
They rarely show the full picture of why a customer relationship is changing.
Product analytics might show a decline in usage. Support platforms might show examples of friction. Sales conversations may reference the competition. Customer interviews and surveys may reveal unmet expectations. Public reviews may point to wider market or product issues.
These signals are typically spread across various systems and teams.
The challenge is joining them together to create a coherent account-level view, and making the reasoning transparent.
This is where an agentic customer intelligence platform comes in: it can pull together the disparate signals, spot the patterns, link them to account context, and help teams work out what needs to be acted on. Platforms like HyperOrbit are built on that premise: moving customer intelligence from isolated reports into connected, business-aware decisions.
The objective is not to replace the CRM or to produce another opaque health score. It is to give the people responsible for revenue a much clearer picture of what is going on across the customer base, and why it matters.
The question founders should ask every week
Most companies can tell you their ARR.
Very few can tell you how much of that ARR is showing credible signs of risk, what the basis of that assessment is, and who is actually doing something about it.
That is the gap to close.
Do not wait for churn to appear in the revenue report. Track the customer signals that come before it, and make the resulting revenue exposure part of your weekly operating conversation.
Frequently asked questions
What is ARR at risk?
The annual recurring revenue in accounts that show credible indicators of potential churn, contraction or renewal difficulty within a defined review horizon, such as the next 90 days.
Is ARR at risk the same as expected churn?
No. It is revenue exposed to identifiable risk, not a forecast of loss. A probability-weighted figure should be calculated separately, and only once the probabilities are calibrated against historical outcomes.
Why not rely on a health score?
A single score collapses different realities. Connecting usage, support and commercial signals across the relationship, and recording the evidence, gives a more reliable picture of whether an account is truly at risk.
What should a founder review each Monday?
The current ARR at risk and affected accounts, what changed since last week, renewals due in 30, 60 and 90 days, the root cause of each risk, and an owner, next step and review date for every material risk.