When a customer cancels, most organisations start asking the same questions.
Why did they go? Was it price? A product gap? Poor service? A competitor? Did the customer stop using the product? Could the account have been saved?
Usually, the answers are already somewhere in the organisation.
Maybe there was a support ticket raised a few weeks ago, a renewal conversation that got tough, an unresolved complaint, or a competitor mentioned in a sales call. At the time, none of these seemed like reasons to worry.
But together, these signs might tell a very different story.
The problem is these signals are usually scattered across different systems and teams. By the time the cancellation shows up in the CRM, the events that led to it may be lost, disconnected, or never escalated.
One helpful way to understand this is by doing a 90-day churn post-mortem.
Instead of only looking at the cancellation reason, piece together the customer’s experience during the 90 days before they decided to leave.
The goal isn’t to prove that churn could have been stopped. It’s to understand what the organisation knew, what it missed, and what it should do differently next time.
Why cancellation reasons rarely tell the whole story
Most organisations record churn using a reason or category:
- Pricing or budget constraints
- Missing product capabilities
- Poor customer experience
- Low product adoption
- Change in business priorities
- Competitor replacement
- Contract or procurement issues
These categories help with reporting but rarely explain the full sequence of events.
Take a customer who chose ‘Pricing’ as their reason for cancellation.
A closer investigation might reveal:
- The customer had raised the issue of product adoption 75 days previously.
- A fundamental workflow was becoming increasingly difficult to use.
- Support tickets on the same issue remained open.
- The customer mentioned a competitor during a review meeting.
- The renewal conversation eventually turned on whether the product was worth the price.
The stated reason was price but the real problem might have been a loss of perceived value.
This distinction matters.
If the organisation only sees the cancellation category, it might offer a discount or change the price. But if it knows the full story, it may find that onboarding, adoption, product usability, or customer success is the real issue.
A churn reason is what the customer says when they leave. A churn post-mortem digs into how that decision actually happened.
The 90-day framework
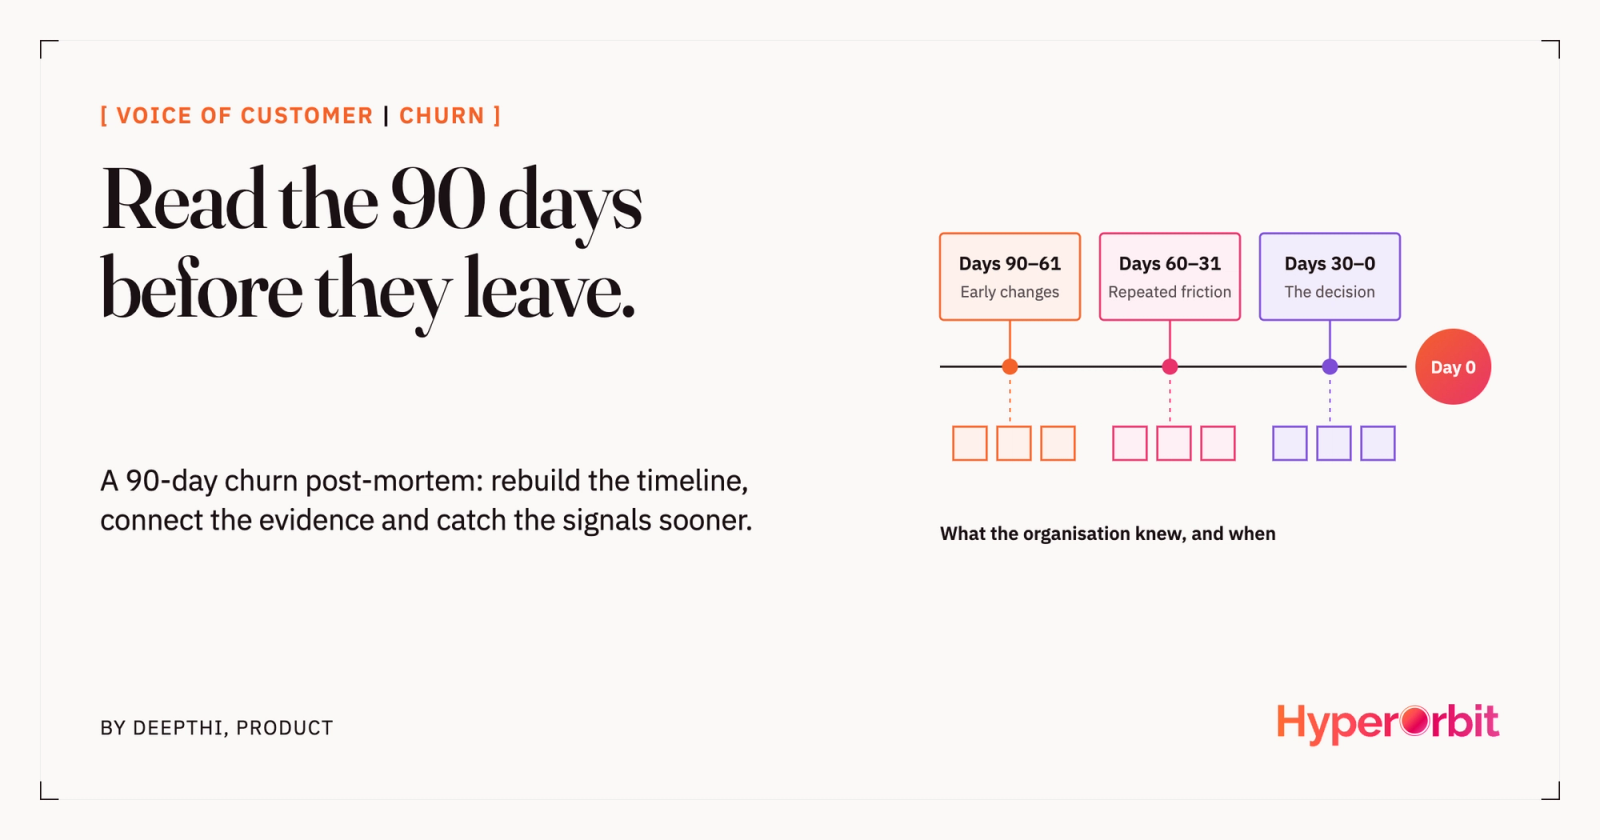
Divide the period before cancellation into three stages:
- Days 90 to 61: Early changes and emerging signals.
- Days 60 to 31: Repeated friction and steadily eroding confidence.
- Days 30 to 0: The escalation, the renewal discussions and the final decision.
This timeline is a practical way to investigate and not a one-size-fits-all churn model. Some customers decide quickly while others have much longer procurement and renewal cycles.
The aim is to give your investigation a consistent structure.
Stage 1: Days 90–61, look for early changes
At this stage the customer may still be ‘healthy’ in the CRM.
There may be no formal escalation, no cancellation request and no explicit statement that the customer is considering a competitor.
Look for changes in behaviour and feedback.
Signals to investigate
Product usage
- Declining frequency of logins or active usage.
- Reduced uptake of key features.
- Fewer users in the key workflows.
- A growing gap between expected and actual product usage.
Customer feedback
- Repeated requests for the same improvement.
- Comments that a workflow is difficult.
- Lower satisfaction levels in surveys or conversations.
- Lower attendance at feedback sessions.
Customer engagement
- Lower attendance at business reviews.
- Slower responses to customer success outreach.
- Fewer strategic conversations.
- Lower engagement from senior stakeholders.
Questions to ask
- When did product usage actually start to change?
- Was the customer using the product in the way it was intended to be used?
- Did the customer raise any issues that weren’t escalated?
- Did the account team notice a shift in engagement?
- Were there any outstanding issues?
Output: A timeline of the early behavioural and feedback changes.
Stage 2: Days 60–31, find recurring friction
This is where isolated signals may start to form a pattern.
The customer may have raised the same issue through several channels. A feature request may have morphed into a regular complaint. Support tickets may have increased. The account team may have started talking about alternatives.
The investigation should now examine the links between the signals.
Signals to investigate
Support and service
- Repeated tickets on the same issue.
- Long-running unresolved cases.
- Multiple escalations involving the same workflow.
- Customers having to explain the same problem repeatedly.
Product experience
- Continued decline in usage.
- Failure to adopt recently introduced features.
- Workarounds replacing intended workflows.
- Friction in the key customer journeys.
Commercial and competitive context
- Questions around contract value and ROI.
- Requests for competitor capabilities.
- Changes in stakeholder expectations.
- Conversations about alternative solutions.
Questions to ask
- Did several teams get the same signal on the same underlying problem?
- Was it treated as a standalone support issue?
- Did the customer explain the business impact?
- Was there a rival or alternative?
- Did anyone link the feedback to account health or renewal risk?
Output: A list of the recurring issues, the evidence for them, and their potential impact on the account.
Stage 3: Days 30–0, reconstruct the final decision
The last month will usually contain the most overt signs of discontent or indeed the commercial decision.
This isn’t always the first visible sign that the customer has decided to leave.
The inquiry should establish what happened, when it happened, and what information the organisation had at that point.
Signals to investigate
- Renewal objections or contract discussions.
- Formal escalation to senior management.
- Requests for data export and migration support.
- Sudden reductions in engagement.
- Direct references to a competing product.
- Requests for cancellation or non-renewal.
- Unresolved issues carried over into the renewal period.
Questions to ask
- When did the customer express an intention not to renew?
- What reasons did the customer give?
- Were those reasons consistent with earlier feedback?
- Which teams were aware of the underlying issues?
- Were any retention actions taken?
- What was the result of that?
Output: A clear account of the decision, the reasons given, and the evidence before it. This helps build the 90-day churn timeline.
Build the timeline from evidence
A useful post-mortem shouldn’t just be a collection of opinions. Build a timeline using actual evidence.
For every meaningful event, record:
- Date: when the signal or interaction occurred
- Source: support, CRM, product analytics, interview, survey or call
- Signal: what the customer said or did
- Theme: product, service, adoption, commercial or competitive
- Impact: what the issue meant for the customer
- Response: what the organisation did
- Owner: which team or person was responsible
- Outcome: resolved, unresolved, escalated or unknown
This helps the team separate what actually happened from what people recall.
An illustrative timeline
Imagine an enterprise customer who cancelled after a tough renewal conversation. The account team’s original CRM entry lists the reason as ‘pricing and budget’. A deeper review reveals the following:
- Day 84: usage of a key workflow begins to decline. Possible implication: adoption may be weakening.
- Day 72: the customer raises a recurring usability concern. Possible implication: product friction.
- Day 58: a similar support issue is raised again. Possible implication: the problem remains unresolved.
- Day 46: the customer asks about a capability available in a competitor product. Possible implication: competitive evaluation.
- Day 34: a customer success review highlights low perceived value. Possible implication: renewal concern.
- Day 21: the customer questions the commercial value of the contract. Possible implication: budget and value pressure.
- Day 8: the customer confirms non-renewal. Possible implication: decision communicated.
- Day 0: the account is marked as churned. Possible implication: cancellation recorded.
This is just an example, not a real customer case or a statistical churn pattern.
The key point is the final cancellation reason doesn’t explain the whole story. The customer may have had a product issue, didn’t get the value they expected, or looked at an alternative before deciding the price wasn’t right. This is a more useful finding for the organisation.
Five questions every churn post-mortem should answer
After reconstructing the timeline, the investigation should clearly answer five questions.
1. What was the earliest observable signal?
Identify the first evidence of a change in customer behaviour, feedback, or engagement.
Do not assume this was the first moment the customer became dissatisfied. It is the earliest signal the organisation can verify.
2. Were multiple signals connected?
Check whether support, product, sales, and customer success were seeing different aspects of the same issue.
A problem that seems minor in one system may become significant when linked with other evidence.
3. Did the organisation understand the business impact?
A recurring complaint may affect adoption, productivity, renewal confidence, or expansion potential.
Determine whether the impact was understood at the time or only became obvious after cancellation.
4. Was there an opportunity to respond?
Identify what the organisation could reasonably have done.
This might include resolving a product issue, improving onboarding, escalating an account concern, providing additional training, or clarifying the customer’s expected outcomes.
Don’t assume every cancellation could have been avoided.
5. What should change across the organisation?
A post-mortem should lead to improvements that go beyond just one account.
For example:
- Improve escalation criteria for repeated support issues.
- Connect product adoption changes with customer feedback.
- Create a consistent process for recording competitor mentions.
- Review accounts with unresolved high-impact issues before renewal.
- Make retention actions and ownership visible across teams.
The goal is to learn from what happened, not just to find someone to blame.
Common mistakes in churn analysis
1. Accepting the CRM cancellation reason as the complete explanation
A cancellation category is a starting point. Check it against customer conversations, usage patterns, and account history.
2. Looking only at the final 30 days
By that time, the customer may have made up their mind. Look at the full 90-day period and go back further if account history shows earlier problems.
3. Treating every negative comment as a churn signal
A complaint doesn’t always mean the customer wants to leave. Watch for repeated issues, customer impact, changes in behaviour, and other evidence.
4. Ignoring product usage
Customers don’t always say when they’re unhappy. Changes in product usage can give clues, but also look at other feedback.
5. Focusing on individual performance instead of systemic causes
If several teams missed the same issue, the problem may be how information moves across the organisation, not the performance of one account manager.
6. Failing to turn the investigation into prevention
If the same issue appears in multiple churned accounts, it deserves attention at the product or operating-model level.
Turn churn post-mortems into a continuous process
A 90-day post-mortem is useful but only looks back at what happened.
It tells you what happened to an account that has already left.
A bigger opportunity is to use this same approach all the time with your current customers.
Instead of waiting for a cancellation:
- Connect customer feedback with product usage and support history.
- Identify repeated issues across accounts.
- Add CRM context to understand account importance.
- Track unresolved issues and their owners.
- Surface competitor mentions and changes in customer expectations.
- Review the evidence before important renewal decisions.
This turns churn analysis from just a reporting task into a way to build ongoing customer intelligence.
It also helps teams tell the difference between a customer who’s just temporarily unhappy and an account where there are several signs of a bigger problem.
From understanding churn to acting on customer risk
This is the problem HyperOrbit is designed to help address.
Customer intelligence shouldn’t be stuck in separate feedback tools or dashboards that don’t talk to each other.
It should bring together what customers say, what they do, what support teams notice, and what account data shows.
HyperOrbit brings these signals together through its customer and competitive intelligence capabilities:
- Chorus helps teams understand feedback and conversations across customer channels.
- Recon adds competitive context to customer and market signals.
- Atlas (beta) connects intelligence to customer and account context.
The goal is to help teams spot new patterns, see which accounts might be affected, and share findings in the workflows where teams can act on them.
AI can help find and connect evidence but shouldn’t treat correlation as certain or say an account will churn without good reason.
Evidence, confidence, and human judgement still matter.
The takeaway
A cancellation is just one event. Churn usually comes from a longer customer experience.
The 90-day post-mortem helps organisations piece together that experience, spot missed signals, and improve team responses.
Start with one churned account.
Rebuild the timeline, connect the evidence, separate what the customer said from real causes, and figure out what could have been done differently.
Then repeat the process across more accounts.
The goal isn’t just to explain churn after it happens. It’s to make sure the organisation learns from every lost customer and spots important signals earlier with the next one.
Want to connect customer feedback, product behaviour, support signals, and account context to understand customer risk? Explore HyperOrbit.
Frequently asked questions
What is a 90-day churn post-mortem?
A review that pieces together a customer’s experience in the 90 days before they cancelled, using feedback, product usage, support history and account conversations, to see what the organisation knew and missed.
Why isn’t the CRM cancellation reason enough?
A reason such as pricing is what the customer says when they leave. The timeline can show an earlier loss of perceived value, an unresolved product issue or a competitor evaluation behind it.
What should a churn timeline record?
For each event: the date, source, signal, theme, impact, the organisation’s response, the owner and the outcome, so the team can separate what happened from what people recall.
Could every cancellation have been prevented?
No. The aim is not to prove churn was avoidable but to understand what was known, what was missed and what should change, so the same signals are spotted earlier next time.