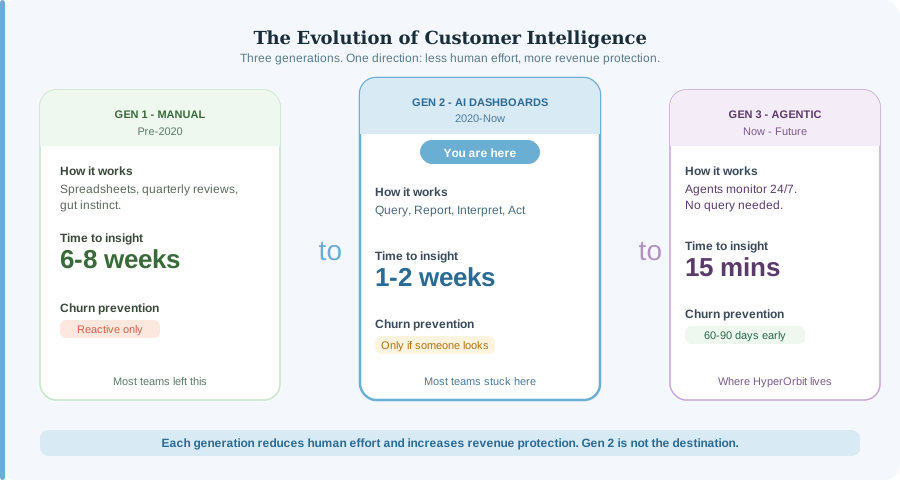
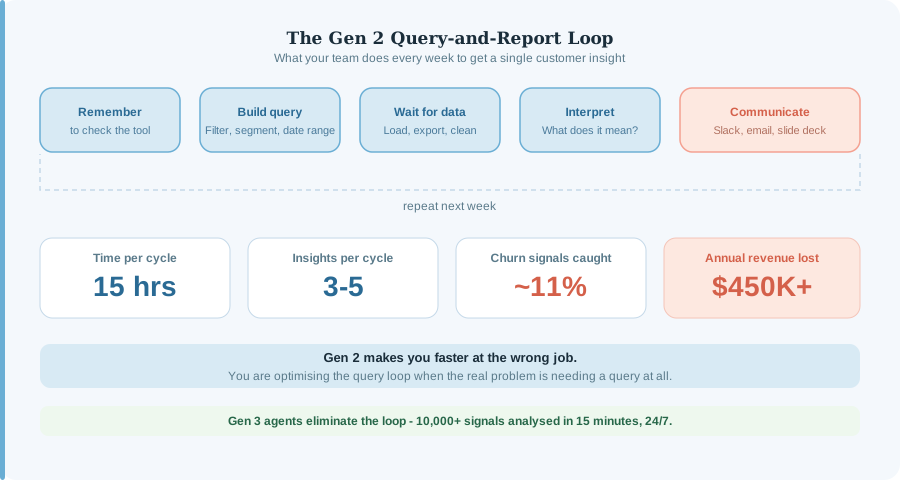
- Someone has to remember to check the tool.
- They have to build the right query — the right filters, date range, segment, and metric combination.
- They wait for data to load, export it if needed, and clean it.
- They interpret what it means in the context of what else they know.
- They communicate it to the people who can act on it.
- Those people decide whether to act.
- If they do, they act — usually 6 to 8 weeks after the original signal.
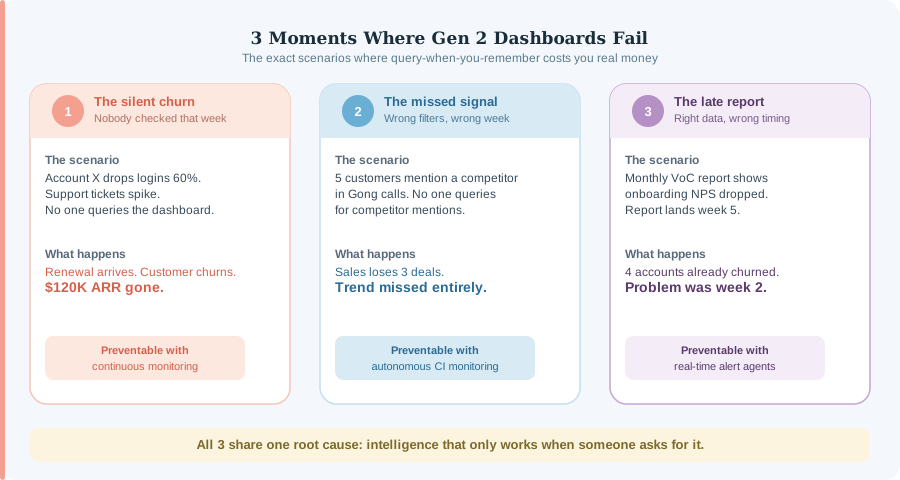
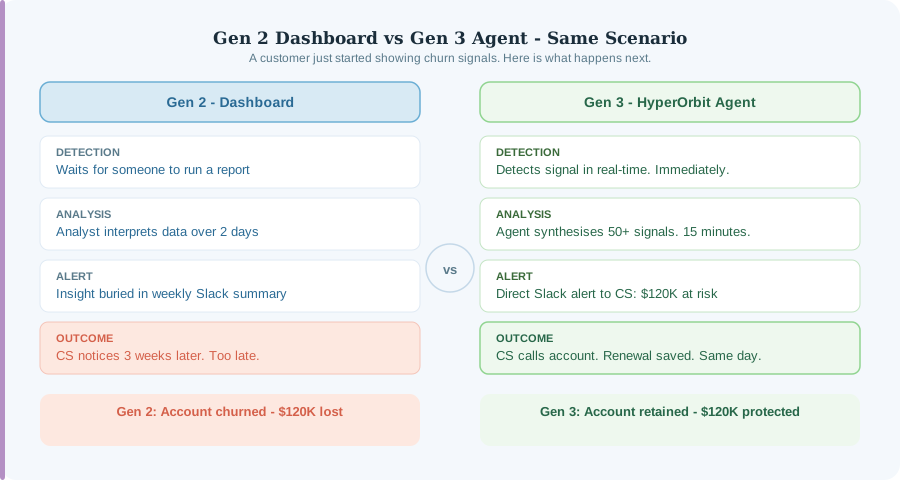
- When did you last catch a churn risk before the customer told you?
- How many analyst hours per week go into building queries and interpreting reports?
- How often do competitive signals from customer conversations reach your sales team within 48 hours?
- What percentage of at-risk accounts get flagged before renewal — not after?
- If your dashboard product shut down tomorrow, would your customers churn faster?
Conclusion
Frequently asked questions
What is the "Gen 2" problem with dashboards?
Someone has to remember to check the tool, build the right query, interpret the result and communicate it before anyone acts. The article estimates action lands six to eight weeks after the original signal.
How do I know whether my dashboard is holding my team back?
Ask when you last caught a churn risk before the customer told you, how many analyst hours go into queries each week, and how often competitive signals from conversations reach sales within 48 hours.
What replaces the dashboard?
A system that reads signals continuously and pushes a decision to the person who can act, rather than waiting for someone to look.
