
17 Minutes
There is a number on your P&L that nobody puts there. It sits between the lines — in the churned accounts from last quarter, the logos that did not renew, the downgrades that preceded cancellation. It does not show up as a single line item. But it is real revenue, and the vast majority of it was preventable.
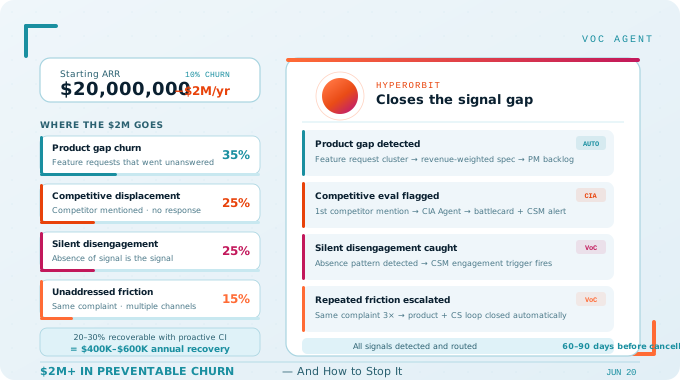
For a mid-market SaaS company at $20M ARR, a 10% annual churn rate represents $2M in revenue walking out the door every year. That is not the interesting number. The interesting number is how much of that $2M had a warning signal — a support ticket citing a product gap, a sentiment trajectory that had been declining for eight weeks, a competitor mentioned twice in renewal calls — that nobody acted on in time.
The answer, consistently, is most of it.
The Real Taxonomy of Preventable Churn
Not all churn is created equal, and not all of it is preventable. Bad churn — the kind that should keep you up at night — comes from customers who should be successful but are leaving because of product gaps, a confusing onboarding experience, terrible support, or because a competitor is simply doing a better job. This churn is a direct reflection of company performance. SaaS Operations
Preventable churn is specifically the subset where the customer sent signals before leaving — and those signals were either not captured, not routed, or not acted on in time.
Proactive customer success can reduce voluntary churn by 20–30%. Genesysgrowth That is the directly addressable number — the share of churn that systematic, proactive intelligence would have caught before the customer made their decision.
At $20M ARR with 10% annual churn, 20–30% of that $2M in churn loss is $400K–$600K annually. Revenue that existed as a warning signal in your support system, your NPS responses, your renewal call notes — waiting to be read by someone who had the time and system to find it.
Most mid-market SaaS companies do not have that system. So the warning goes unread. The customer churns. The revenue is recorded as a loss.
Four Categories of Preventable Churn — and the Signal That Predicted Each
Category 1: Product gap churn (~35% of preventable churn)
The customer churned because the product did not do something they needed it to do. This is the most common type of preventable churn, and it is nearly always telegraphed in advance.
Voluntary churn accelerates 90 days before cancellation, with product usage declining by an average of 41% in the quarter preceding cancellation — suggesting that proactive engagement triggered by usage drop-offs could intercept a significant portion of voluntary churn. Focus Digital
But usage decline is a lagging indicator. The leading indicator is the feature request that went unanswered, the support ticket that asked whether functionality existed, the NPS comment that said the product was great but did not do one specific thing the customer needed.
These signals appear in feedback data weeks before usage starts to decline. A customer who asks three times over six months whether a specific integration exists, receives the same "not on our roadmap" answer each time, and then stops asking — has not resolved the issue. They have started evaluating alternatives.
Category 2: Competitive displacement (~25% of preventable churn)
The customer churned because a competitor offered something they needed. This is structurally related to product gap churn, but the signal pattern is different. Instead of feature requests that go unanswered, the signals are competitor mentions — initially neutral, then comparative, then evaluative.
73% of consumers are ready to jump ship to a competitor after just a few bad experiences — and 56% won't even bother to complain before they leave. SaaS Operations
The customers who do mention a competitor in their feedback are giving you an early warning that the 56% who leave silently will not. That warning needs to be caught at the first mention, not at the third.
Category 3: Silent disengagement (~25% of preventable churn)
This is the hardest category to catch — not because the signal is subtle, but because it is an absence rather than a presence. The customer stops requesting features. They stop engaging with product update emails. They decline QBRs. They submit fewer support tickets. Their usage holds steady, so the health score stays green, but the behavioral pattern is disengagement.
Login frequency decline provides the earliest signal at 60 days before churn. Other key indicators include support ticket spikes — showing a 3× higher churn risk — feature adoption below 30% correlating with 80% first-year churn, and NPS scores under 20 producing 2× normal churn. Genesysgrowth
Silent disengagement is the customer equivalent of going quiet before ending a relationship. The silence is the signal.
Category 4: Unaddressed friction (~15% of preventable churn)
The customer churned because a recurring problem never got fixed. They reported it. Multiple times. Through multiple channels. Nothing changed. They did not make a dramatic exit — they just stopped renewing.
Customers want to be heard, and more importantly, they want to see action. If users give feedback but nothing changes, trust erodes. Vitally
The signal here is repetition — the same theme appearing in support tickets, NPS comments, and CS call notes across multiple months. A single complaint is an outlier. The same complaint from the same account across six different interactions over three months is a customer who has been trying to tell you something.
Why Most Mid-Market SaaS Teams Miss These Signals
The signals exist. The problem is structural, not motivational.
A mid-market SaaS company at $20M ARR typically has a CS team managing 100–300 accounts, a product team running biweekly sprints, and a sales team processing a significant volume of renewal conversations. Each team sees a slice of the feedback picture. None of them have a complete view.
The CS team knows which accounts are in active crisis. They do not have time to read every support ticket from every account to detect the early pattern of silent disengagement.
The product team knows which features are being requested. They do not have systematic visibility into which feature gap requests are concentrated in accounts with declining sentiment or approaching renewals.
The sales team knows which renewals are at risk because someone has told them directly. They do not have early warning of which accounts will be at risk in 60 days — the ones who have not said anything yet.
Companies that track product usage at the feature level identify at-risk accounts 3–6 weeks earlier than those relying on billing data alone. Manual CS processes break down at scale. Automated playbooks that fire Slack alerts, create CRM tasks, and send targeted messages when health scores drop ensure no at-risk account goes unnoticed. Perly
The intervention window exists. The system to catch the signal within that window — and route it to the right person before it closes — usually does not.
The Math on Earlier Detection
The revenue case for catching preventable churn earlier is simple arithmetic that compounds significantly over time.
A mid-market SaaS company at $20M ARR with a 10% annual churn rate is losing $2M in ARR every year. If 25% of that churn is preventable with proactive intervention — a conservative estimate — that is $500K annually in recoverable revenue.
Reducing your churn rate by just 5% can boost profits by 25%. K-38 Consulting
But the math runs deeper than one year. Customer lifetime value calculations make the compounding effect stark: a customer retained for an additional 12 months is not just $X in recurring revenue — it is $X multiplied by whatever expansion, upsell, and referral that customer generates over that extended lifetime. The value of a rescued account is always greater than its ARR contribution in the year of the intervention.
Companies leveraging AI for churn prevention report 10–15% churn reduction over 18 months. Fullview At $20M ARR, a 10% churn reduction is $200K in preserved annual revenue. At $50M ARR, the same percentage is $500K. The absolute value scales with the business.
What Catching the Signal in Time Actually Looks Like
The four categories of preventable churn described above each require a different intervention — but they share the same prerequisite: the signal must reach the right person before the customer makes their decision, not after.
Product gap churn requires the product team to know — before sprint planning, not in the post-mortem — which feature gaps are concentrated in accounts with declining sentiment or approaching renewals. Not all feature requests are equal. The same request from twelve accounts in the $50K+ ARR band has different urgency than the same request from twelve SMB accounts.
Competitive displacement requires the sales and CS teams to know — at the moment of the first competitive mention, not at the renewal call — that an account has entered an active evaluation. The response to "we're starting to look at alternatives" in month three is categorically different from the response to the same statement in month eleven.
Silent disengagement requires a system that monitors behavioral absence — not just behavioral presence. The account that used to submit feature requests every month and has not submitted one in six weeks is sending a signal. No human reading tickets in their spare time catches that signal. A continuous monitoring system does.
Unaddressed friction requires a feedback loop between the product team and the CS team that operates faster than the quarterly roadmap cycle. When the same account reports the same problem three times in three months, the CS team needs to know the product team has acknowledged it — and the product team needs to know that unacknowledged friction in that account is a churn risk, not just a feature request.
Conclusion
The Revenue Was There. The System Was Not.
Great customer success isn't about firefighting — it's about fire prevention. By the time a customer tells you they're unhappy, you're already behind. SaaS Operations
The $2M in preventable churn that a mid-market SaaS company loses annually did not disappear silently. It announced itself — in feature requests, in support tickets, in declining engagement patterns, in the careful phrasing of customers who were already comparing alternatives. The announcements were there. They were just distributed across twelve channels, filtered through three different teams, and never connected into a coherent picture until it was too late.
The signal-to-action gap is not a CS capacity problem. It is an intelligence architecture problem. More people doing the same manual reading and routing process will narrow the gap slightly and briefly. A system that automatically aggregates, cross-references, and routes the right signal to the right person closes it.
That is the problem HyperOrbit is built to solve. The Customer Intelligence Maturity Assessment will show you exactly where your current architecture is losing the signal — and which category of preventable churn that translates to for your ARR.