
CHAPTER 1
What Is Churn Really Costing You?
Every SaaS leader knows churn is bad. But most don't know exactly how bad — until they sit down and do the math. The true cost of customer churn goes far beyond lost MRR. It compounds across your entire business in ways that are rarely captured in a single dashboard.
The Hidden Churn Tax
When a customer churns, the immediate damage is visible: lost ARR, a dip in NRR, a gap in the renewal forecast. But that's just the surface. The real cost is threefold:
Acquisition replacement cost: Replacing a churned customer typically costs 5–7× more than retaining them. For a $20K ARR customer, that's $100K–$140K in CAC to break even.
Expansion revenue erosion: Every churned account eliminates future upsell and cross-sell opportunity — often worth 2–4× the base contract over a 3-year LTV window.
Organizational distraction: Sales, CS, and product teams spend disproportionate energy in firefighting mode when churn is high — stunting proactive growth initiatives.
The Churn Blind Spot: You're Always Looking Backwards
Here's the core problem with how most companies track churn: they measure it after it happens. Monthly churn reports, quarterly NPS surveys, post-mortem win-loss calls — every signal arrives after the customer has already decided. The average B2B SaaS customer makes the decision to churn 60–90 days before they formally cancel. That's a 60–90 day window of opportunity that most teams never see.

Churn by the Numbers in 2026
The macro environment has made retention even more critical. Enterprise procurement cycles have lengthened. Buyer scrutiny has intensified. Every renewal is now a re-evaluation. According to recent SaaS benchmarks:
Average annual B2B SaaS churn is 10–15% for SMB, 5–8% for mid-market, and 3–5% for enterprise
Companies in the bottom quartile of retention spend 3× more on growth marketing just to maintain flat ARR
NRR above 120% correlates with 40% faster ARR growth compared to companies with NRR below 100%
58% of CS leaders say their biggest challenge is identifying at-risk accounts early enough to intervene
CHAPTER 2
Companies have been trying to solve churn for as long as subscription businesses have existed. Health scores, manual QBRs, NPS programs, and support ticket reviews — all valid attempts. All fundamentally limited. Here's why the old playbook can't keep up.
The Four Failure Modes of Legacy Retention
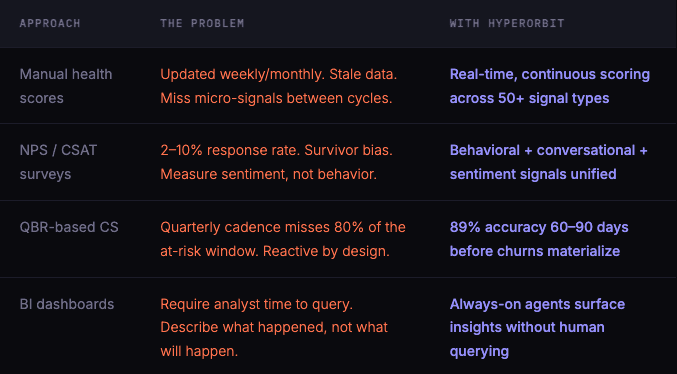
The Signal Coverage Gap
The deepest flaw in legacy retention tools is incomplete signal coverage. A typical CS platform ingests 3–5 data sources: product usage, support tickets, NPS scores, and CRM data. But modern customer relationships generate signals across dozens of touchpoints — Gong calls where a champion mentions "evaluating alternatives," G2 reviews that surface emerging frustration, Slack conversations where power users go quiet, and competitor job postings that telegraph capability gaps.
No human team has the bandwidth to synthesize these signals in real time. That's not a people problem — it's a systems architecture problem. And it's exactly what AI agents were built to solve.
CHAPTER 3
The AI Churn Prevention Framework
Effective AI-powered churn prevention isn't a single feature — it's a three-layer architecture: Listen → Predict → Act. Each layer builds on the previous, and together they create a closed-loop system that gets smarter with every customer interaction.
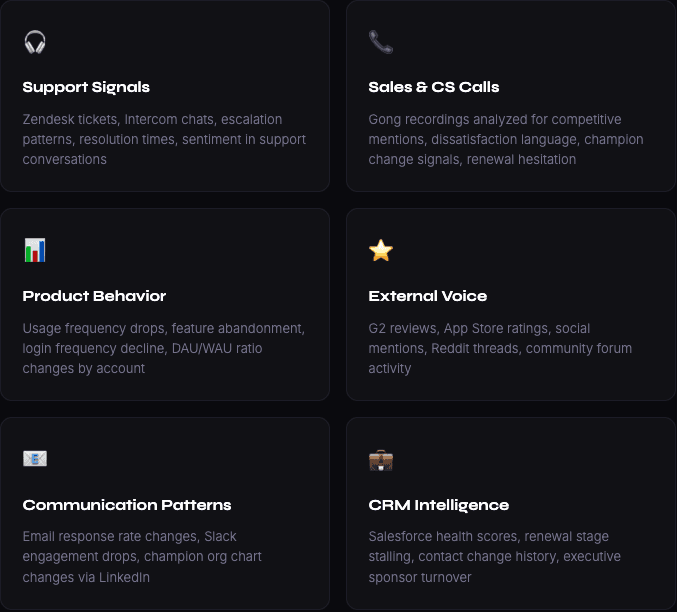
Layer 1: Listen — Unified Signal Intelligence
The foundation is comprehensive signal capture. AI agents must monitor every channel where customers express intent, frustration, satisfaction, or disengagement:
Layer 2: Predict — Behavioral AI Modeling
Raw signals are noise without intelligence. The prediction layer applies machine learning models trained on historical churn patterns to assign churn probability scores to each account in real time. Effective prediction incorporates:
Multi-signal correlation: No single signal predicts churn reliably. AI correlates behavioral, conversational, and external signals to build a holistic risk picture
Account segmentation: Risk thresholds differ by ARR tier, product tier, industry, and customer lifecycle stage
Temporal pattern recognition: AI identifies seasonal churn patterns, post-QBR risk spikes, and champion-change cascades
Competitive signal weighting: Mentions of specific competitors in calls or reviews trigger elevated risk scores even if product usage looks healthy
Layer 3: Act — Autonomous Intervention Orchestration
Prediction without action is just expensive anxiety. The action layer is where AI-powered churn prevention creates direct revenue impact. When risk thresholds are crossed, agents automatically:
Alert the assigned CSM with a full context brief and recommended next action
Create a task in Jira / Salesforce / Asana with pre-populated account health data
Schedule an executive check-in if the churning contact is a senior stakeholder
Generate a customized retention offer or success plan based on account history
Trigger a product team notification if the churn signal is feature-related
CHAPTER 4
These are the behavioral signals that consistently precede churn — discovered through analysis of thousands of B2B SaaS customer journeys. Human teams miss most of these because they occur subtly, across multiple systems, and often 60–90 days before any explicit risk indicator surfaces.
Behavioral Signals (Product & Usage)
Signal 1 — Login frequency drop: A 30%+ reduction in weekly logins, especially by primary users, predicts churn with 72% accuracy when sustained for 3+ weeks
Signal 2 — Feature abandonment: Sudden stop in usage of a core workflow feature — often triggered by a workflow change, team restructuring, or competitive evaluation
Signal 3 — User seat shrinkage: Reduction in active users from peak usage, especially in the 90–120 day pre-renewal window
Signal 4 — Support to usage ratio spike: When support ticket volume increases while usage stays flat or declines, the customer is struggling — not growing
Conversational Signals (Calls, Tickets, Emails)
Signal 5 — Competitor name-drops in calls: Gong analysis consistently shows competitor mentions in CS or renewal calls precede churn by 45–75 days
Signal 6 — "Evaluating options" language: Specific phrase patterns in support tickets or emails — subtle requests for data exports, integration docs, or contract terms — signal active evaluation
Signal 7 — Escalation without resolution: Repeated escalations on the same issue, especially when the customer goes quiet after escalation, indicate lost confidence
Signal 8 — Response latency increase: When a previously responsive champion starts taking 3–5× longer to reply to CS outreach, relationship quality has degraded
Organizational & External Signals
Signal 9 — Champion departure: When the primary contact or executive sponsor changes roles, 38% of accounts churn within the next 6 months without proactive re-engagement
Signal 10 — Procurement team emergence: When new contacts from procurement, finance, or legal join account conversations outside of renewal season, re-evaluation is underway
Signal 11 — Negative review publishing: A G2 or Trustpilot review — especially one that mentions a competitor — is a public churn signal that requires immediate CSM escalation
Signal 12 — Budget freeze language: Macro signals — layoffs, funding round failure, cost-cutting announcements — that correlate with high churn probability for accounts in those verticals

CHAPTER 5
Autonomous Intervention Workflows That Actually Work
Knowing which accounts are at risk is half the battle. The other half is executing the right intervention — fast enough, personalized enough, and coordinated enough across CS, Sales, and Product to actually save the account. Here are the intervention playbooks that move the needle.
Playbook A: The Early Risk Intervention (Day 1–30 of Signal)
01 AI generates risk brief
HyperOrbit compiles a full context package: account health history, signal triggers, revenue at stake, recommended intervention type, and comparable accounts that were saved successfully.
02 CSM receives Slack alert with action recommendation
Not just a score — a specific recommendation: "Schedule executive alignment call. Bring product roadmap update. Last positive interaction: 47 days ago."
03 Automated task creation in Salesforce / Jira
No manual logging. The intervention task is created, assigned, and deadline-set automatically, with full context attached.
04 Product team notified if signal is feature-driven
If the churn signal correlates with a missing or broken feature, the PM receives an automated brief with revenue impact and affected account count.
Playbook B: The Champion Change Response
Champion departure is one of the highest-risk events in any account. The autonomous workflow triggers within 24 hours of a contact change detected in Salesforce or LinkedIn:
Identify the new decision-maker from CRM and LinkedIn data
Generate a personalized "new champion brief" with product value summary, ROI metrics, and relationship history
Alert Sales and CS simultaneously for coordinated outreach
Schedule an executive-to-executive introduction if ARR threshold is met
Playbook C: The Competitive Threat Response
When HyperOrbit's Competitive Intelligence Agent detects competitor mentions in an at-risk account's signals, the response workflow escalates automatically:
Generate an up-to-date competitive battlecard specific to the competitor mentioned
Alert the account's CSM with a competitive positioning brief tailored to the customer's use case
Flag for Sales leadership if ARR exceeds the enterprise threshold
Surface 3 customer success stories from similar accounts where HyperOrbit won head-to-head
CHAPTER 6
The 90-Day AI Churn Prevention Playbook
Implementing AI-powered churn prevention isn't a big-bang project. The most successful teams deploy in phases, proving ROI at each stage before expanding. Here's the 90-day framework used by HyperOrbit's fastest-growing customers.
Days 1–14 >> Foundation: Connect, Calibrate, Baseline
Connect your core data sources (Zendesk, Salesforce, Gong, product analytics). Run historical data through the prediction model to establish your current at-risk account list. Identify your top 10 accounts most likely to churn in the next 90 days.
Days 15–30 >> Signal Expansion: Layer in External & Conversational Data
Add review platforms, social listening, and call recording integrations. Begin receiving daily signal digests in Slack. Assign CSM owners to each at-risk account identified in the first two weeks.
Days 31–60 >> Intervention: Execute Playbooks, Measure Saves
Run the Early Risk Intervention playbook on your top 10 at-risk accounts. Track save rate, time-to-intervention, and NRR impact. Iterate on the intervention workflow based on what's working.
Days 61–90 >> Scale & Automate: Expand Coverage, Reduce Manual Work
Expand monitoring to full account base. Enable autonomous workflow triggers for lower-ARR accounts. Report first 90-day ROI: accounts saved, revenue protected, CS hours reclaimed.
CHAPTER 7
Measuring What Actually Matters
Vanity metrics are easy to report. Revenue-protecting metrics are what boards and CFOs care about. Here's the measurement framework for AI-powered churn prevention programs.
Primary Business Metrics
Net Revenue Retention (NRR): The single most important number. Target: 100%+ for stability, 120%+ for growth-stage SaaS
Gross Revenue Retention (GRR): Tracks pure churn without expansion. Shows the health of your retention motion in isolation
Save Rate: Of all at-risk accounts flagged by AI, what % were successfully retained after intervention? Benchmark: 60–75% save rate at 90-day programs
Revenue Protected: Total ARR of saved accounts. This is your program's direct ROI number
Leading Indicators (Track Weekly)
At-Risk Account Count by Tier: How many accounts are in yellow/red status across ARR segments
Time to Intervention: Average days from risk signal detection to first CSM outreach. Target: under 48 hours
Signal-to-Save Correlation: Which signal types are most predictive of churn vs. false positives in your specific customer base
CSM Response Rate to AI Alerts: Measures adoption — if CSMs aren't acting on alerts, the workflow needs refinement
Operational Efficiency Metrics
Hours Reclaimed Per CS Rep Per Week: How much manual analysis time has been eliminated. HyperOrbit customers average 9–15 hours/week saved per rep
Accounts Per CSM: As AI handles monitoring and triage, CSM coverage ratios improve significantly
Intervention Cost Per Save: Total CS intervention time × loaded cost ÷ ARR saved. This justifies the program investment to finance
CHAPTER 8
HyperOrbit in Action: Real Results
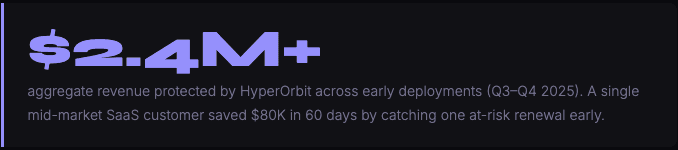
The following outcomes are from HyperOrbit's beta customer cohort (Q3–Q4 2025), spanning mid-market SaaS companies with 50–500 employees and $5M–$50M ARR.Primary Business Metrics.

The HyperOrbit Difference
The following outcomes are from HyperOrbit's beta customer cohort (Q3–Q4 2025), spanning mid-market SaaS companies with 50–500 employees and $5M–$50M ARR.Primary Business Metrics.

Bonus Resource
ROI Worksheet
Calculate your churn prevention program's revenue impact. Fill in your numbers to generate a business case for stakeholders.

